Part 1: Methodological Commentary on Population Coverage and External Validity in U.S. Shelter Dog Census Research
Download the full version:
A Note to Our Readers: Why ARFC Undertook This Review
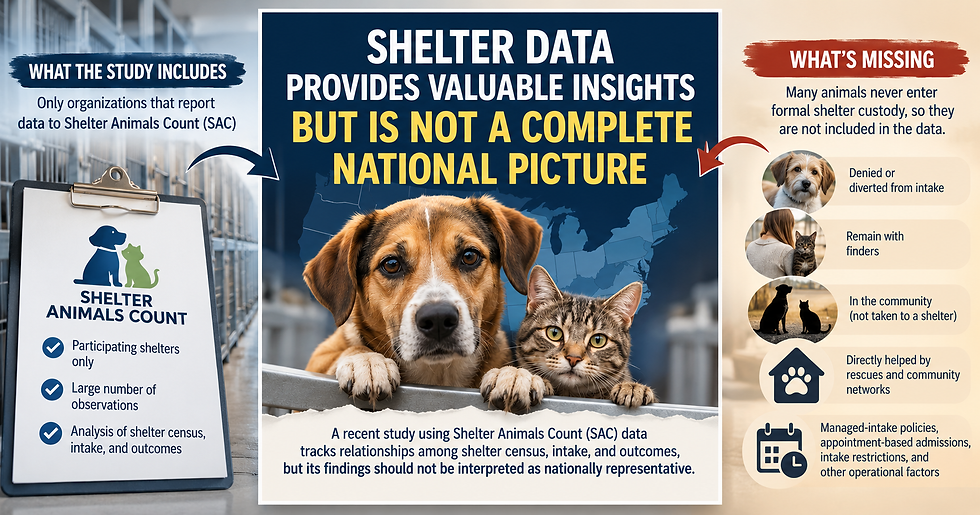
When research is presented as a national reference, we should first ask: how much of the nation is actually represented in the data?
Animal Rescuers For Change (ARFC) conducted a detailed methodological review of the recently published study Shelter Dog Census Changes Track Intakes but Resolve Slowly via Outcomes and Especially Adoptions. The study relies on organizations voluntarily reporting to Shelter Animals Count (SAC), yet our review raises substantial questions about whether this dataset supports generalizations to the broader U.S. shelter system or companion animal homelessness nationally.
Our California analysis illustrates the scale of the concern. Using a historical statewide estimate of at least 300 shelters, our 2023–2025 review identified 94 organizations reporting at least some SAC data and only 65 with complete annual datasets—no more than approximately 31% and 22%, respectively, using that denominator.
And participation is not the only problem.
We found no comprehensive national sampling frame against which representativeness can be established; substantial variation in reporting and historical data availability; and different methodologies for calculating even commonly used measures such as Life Release Rate, meaning apparently similar statistics may not always measure the same thing.
Most importantly, shelter datasets can miss an entire population of animals.
Shelter data begins at admission. Animal homelessness does not.
Animals denied or deferred intake, left with finders, redirected to rescues, placed on waiting lists, diverted through community programs, or otherwise remaining outside shelter custody may never appear in conventional shelter statistics. In the San Jose records we examined, approximately 22% of relevant animals presented for assistance during a seven-month period were not documented as accepted into shelter custody.
We also examined major California shelter systems where recorded intake has fallen dramatically from earlier Pre-COViD levels by 40 % at times. Without measuring managed intake, admission restrictions across the system , declined and deferred intakes, finder retention, diversion, rescue intervention, and other pre-admission pathways, declining recorded intake cannot by itself establish declining companion animal homelessness or declining community need.
In our opinion: When shelters resort to limiting intake because demand exceeds their capacity, fewer recorded admissions are not evidence of improvement—they may be evidence of a growing crisis that is increasingly being carried by the community
These issues go directly to the question of what the study can reasonably be generalized to represent.
Please read our full analysis. We examine population coverage, low and uneven participation, missing animals, changing shelter-access practices, historical-data limitations, inconsistent performance measures, and the distinction between shelter operations and the broader homeless-animal population. We also provide recommendations to researchers and data analysts and ask the authors and publisher to clearly qualify claims that these findings constitute a “national reference.”
A large voluntary dataset is not automatically a national dataset—and animals missing from the statistics are still part of the problem we are trying to measure.
Methodological Commentary on Shelter Dog Census Changes Track Intakes but Resolve Slowly via Outcomes and Especially Adoptions: Population Coverage, External Validity, and Measurement of Companion Animal Homelessness
A Commentary by Animal Rescuers For Change (ARFC)
Prepared by: Animal Rescuers For Change (ARFC)
Publication examined: Mavrovouniotis and Hassen, Shelter Dog Census Changes Track Intakes but Resolve Slowly via Outcomes and Especially Adoptions, Published: 4 August 2026
Scope of this Commentary: This Commentary examines the methodological basis for interpreting the study's findings as nationally representative or as providing a national reference for U.S. animal shelters. It focuses particularly on population definition, organizational coverage, external validity, measurement of animals outside formal shelter custody, historical comparability, and consistency of shelter performance measures.
Abstract
The study Shelter Dog Census Changes Track Intakes but Resolve Slowly via Outcomes and Especially Adoptions analyzes relationships among shelter census, intake, and outcomes using data reported to Shelter Animals Count (SAC). Published within the Special Issue Homelessness of Dogs and Cats and the Role of Animal Shelters in the Animal Protection System: Challenges, Strategies, and Future Directions, the study applies shelter-based data to questions relevant to companion animal population dynamics.
However, a major limitation is the paper's characterization of its findings as nationally representative or as establishing a national reference for U.S. animal shelters.
The study is based entirely on organizations reporting data to Shelter Animals Count. The authors describe the research as an analysis of sheltering organizations “in the United States” and state that government-related organizations may be less susceptible to participation bias. After multiple exclusions and filtering steps, the longest reporting sequences contained data from 860 government-related organizations and 878 non-government organizations; the final regression dataset was further reduced to 831 government-related and 845 non-government organizations.
The number of observations is substantial, but sample size is not the same as representativeness.
This Commentary examines methodological considerations affecting interpretation of such findings, including definition of the study population, representativeness of participating organizations, organizational and intake-weighted coverage, consistency of reporting methodologies, and operational policies that determine whether animals enter formal shelter custody. California is used as an illustrative case study because publicly available governmental records, municipal reports, public-record responses, and SAC participation information permit examination of several of these issues.
Recorded shelter intake is influenced not only by underlying community animal populations but also by managed-intake systems, appointment-based admissions, intake restrictions, diversion programs, finder-retention practices, rescue capacity, and other pathways through which animals may remain outside formal shelter custody. The analytical dataset does not directly measure several of these variables. In addition, review of California shelter reporting demonstrates variation in organizational participation, historical data availability, and calculation of commonly reported performance measures, including Life Release Rate.
These limitations affect population definition, construct validity, measurement comparability, and external validity. National shelter research would be strengthened by defined sampling frames, transparent organizational and intake-weighted participation measures, standardized reporting methodologies, documentation of shelter-access policies, and explicit distinction between recorded shelter populations and the broader population of companion animals requiring intervention.
1. Introduction
Reliable data are fundamental to scientific evaluation of companion animal welfare systems. As quantitative analyses of shelter operations are increasingly incorporated into scientific literature, governmental policy discussions, funding decisions, and operational planning, the methodological characteristics of the underlying datasets become increasingly important.
Mavrovouniotis and Hassen's Shelter Dog Census Changes Track Intakes but Resolve Slowly via Outcomes and Especially Adoptions analyzes relationships among shelter census, intake, and outcomes using data reported to Shelter Animals Count. The article appears within the Special Issue Homelessness of Dogs and Cats and the Role of Animal Shelters in the Animal Protection System: Challenges, Strategies, and Future Directions.
This context raises an important methodological distinction. The study analyzes animals recorded within participating shelter systems; however, shelter-recorded animals represent only one component of the broader population of homeless dogs and cats. Animals that are denied or diverted from intake, remain with finders, are abandoned in the community, or otherwise remain outside participating shelter systems may not be represented in the dataset. Therefore, trends in recorded shelter intake should not, by themselves, be interpreted as equivalent trends in the broader homeless-animal population.
Companion animals requiring assistance may remain outside formal shelter custody because of managed-intake policies, appointment-based admissions, intake restrictions or suspensions, diversion programs, finder-retention practices, waiting lists, and direct intervention by nonprofit rescue organizations or community networks. Such animals may continue to require housing, veterinary care, sterilization, behavioral support, reunification, or permanent placement without appearing as shelter admissions.
Consequently, recorded shelter intake may reflect both underlying community animal need and operational decisions governing access to shelter services. A decline in recorded intake can therefore arise from changes in community animal populations, changes in admission policies, changes in shelter capacity, diversion to other providers, or combinations of these factors.
Interpretation of national shelter benchmarks consequently depends upon two separate methodological questions: whether the statistical relationships observed within the analytical dataset are valid, and whether the underlying dataset adequately represents the population and phenomenon to which broader conclusions are applied.
This Commentary addresses the latter. It examines population definition, organizational coverage, external validity, construct validity, measurement consistency, historical data availability, and operational practices that influence whether animals enter the measured shelter population.
2. Definition of the Study Population and External Validity
External validity depends upon the relationship between an analytical sample and the population to which conclusions are applied. Evaluation of representativeness therefore requires both a defined target population and sufficient information to determine what proportion of that population is represented.
The underlying population represented by national voluntary shelter datasets is difficult to establish because there is no comprehensive national sampling frame identifying all municipal shelters, government-contracted shelters, private nonprofit shelters, and nonprofit rescue organizations potentially comprising the animal welfare system.
Without a defined denominator, the proportion of eligible organizations represented within an analytical dataset cannot be determined.
A large number of observations does not, by itself, establish national representativeness. Evaluation of external validity requires information concerning both the numerator—the participating organizations—and the denominator—the total population from which those organizations are drawn.
Without that information, several relevant questions remain unresolved:
What proportion of government-operated shelters is represented?
What proportion of government-contracted shelter systems is represented?
What proportion of nonprofit shelters and rescue organizations is represented?
How does participation vary among states?
Are high-volume municipal systems proportionally represented?
Do participating and non-participating organizations differ systematically?
Has participation remained sufficiently stable across the analytical period to support longitudinal comparison?
These factors affect the scope of inference that can reasonably be drawn from a voluntary reporting system.
Accordingly, findings describing participating organizations should be distinguished from findings intended to characterize the broader U.S. shelter or companion animal welfare population unless population coverage and representativeness have been established.
3. California Case Study: Organizational Coverage and the Absence of a Defined Sampling Frame
California illustrates the difficulty of evaluating organizational coverage when no comprehensive governmental sampling frame exists.
California currently lacks a single official statewide registry identifying all municipal shelters, government-operated animal service agencies, government-contracted shelters, nonprofit shelters, and rescue organizations. California Department of Public Health shelter-related reporting historically provided statewide information, but that reporting structure ended after 2016. Subsequent shelter information has become distributed among local governments, individual shelter systems, third-party organizations, and voluntary reporting platforms.
Our review of municipal and county sources, governmental records, public-record responses, organizational websites, and SAC participation information identified more than 200 government-operated or government-contracted animal shelter/service entities or systems in California. Because no authoritative statewide roster exists against which this compilation can be validated, this figure should be treated as a documented working population rather than a definitive statewide census.
From 2024 ARFC Analysis: Comparison with 2024 SAC participation information identified approximately 70 California organizations reporting some data and approximately 60 reporting a complete annual dataset in the reviewed material. On the basis of the independently identified public shelter population, complete organizational coverage was therefore approximately 30–35%, leaving approximately 65–70% of identified public shelter organizations not fully represented in that annual reporting comparison.
In 2024, from 200+ California government animal services, shelters, and rescues holding government contracts, Only 70, or 35%, submitted any of their animal statistics to the Shelters Animal Count database. Even more concerning, only 60, amounting to a mere 30%, reported statistics for the entire year. This glaring lack of reporting implies that a significant 70-75% of California’s animal intake and outcome data from these crucial organizations remains unaccounted for. Considering that 85% of all animal intakes in California occur within shelters, the true extent of the issue is obscured. It’s evident that many of the state’s highest euthanasia rate shelters opt not to disclose their statistics, suggesting that the actual intakes and euthanasia rate in California is likely substantially higher.
The proportion of rescue organizations contributing data to SAC is even smaller. California has approximately 3,700 animal rescue nonprofit organizations, yet only a small fraction are represented in available sheltering datasets.
Based on additional findings in 2026 and more in-depth research of historical information, ARFC identified the following government documentation concerning California’s shelter population:
A 2015 California Commission on State Mandates document cited a survey identifying 246 public and 187 private animal shelters in California. However, this figure is historical and may reflect a different method of counting individual shelter facilities and organizations. https://csm.ca.gov/matters/14-9811-I-03/doc5_001.pdf
In 2020, the California Legislative Analyst’s Office, LAO, reported that California had more than 300 public and private animal shelters combined, noting that some local governments operate shelters directly while others contract with nonprofit organizations to provide sheltering services. https://lao.ca.gov/Publications/Report/4168
The LAO also cautioned that statewide euthanasia statistics were not fully reliable for trend analysis because shelter participation in the state survey was inconsistent, even though the available data suggested euthanasia was declining.
Therefore, using the most recent approximate statewide estimate of 300 shelters, the participation ratio is recalculated based on that total.
From 2026 Analysis (Aug 15 2026) Shelter Animals Count: Comparison with 2023–2025 Shelter Animals Count (SAC) participation data identified 94 California organizations reporting at least some data, of which only 65 submitted complete annual datasets. Even using the LAO’s historical estimate of 300 shelters as the minimum denominator, no more than approximately 31% were represented by any SAC reporting identified in the 2023–2025 comparison, while no more than approximately 22% were represented by complete annual datasets.
Organizational participation, however, is only one measure of coverage. Thirty percent of organizations could theoretically account for a substantially larger—or smaller—percentage of statewide intake depending upon which organizations participate. A large metropolitan shelter system may process as many animals as numerous smaller jurisdictions combined.
Therefore, national and statewide datasets should ideally report both organizational coverage and intake-weighted coverage. Where relevant, coverage of euthanasia, transfers, adoptions, and other major outcomes may also warrant reporting.
Please read our full report California Shelter And Rescue Data Transparency Gaps. We hope it contributes to a broader discussion about what California should actually be measuring, what may currently be missing, and what information legislators need to make informed decisions.
Shelter Animals Count Reporting History: 77 California Government Animal Services
Source: Shelter Animal Count
# | Organization Name | Comments | County | Last Reported |
1 | Berkeley Animal Care Services | No data 2023 and earlier | Alameda | July 2026 |
2 | California City Animal Shelter | Kern | July 2026 | |
3 | City of Chico Animal Shelter | Butte | July 2026 | |
4 | City of Hesperia Animal Shelter | San Bernardino | July 2026 | |
5 | City of Los Angeles, Department of Animal Services | Los Angeles | July 2026 | |
6 | City of Perris | Riverside | July 2026 | |
7 | County of Santa Clara Animal Shelter | Santa Clara | July 2026 | |
8 | Elk Grove Animal Services | Sacramento | July 2026 | |
9 | Fresno Animal Center | No data 2023 and earlier | Fresno | July 2026 |
10 | Front Street Animal Shelter | Sacramento | July 2026 | |
11 | Inyo County Animal Services | No data prior 2026 | Inyo | July 2026 |
12 | Kerman Police Department | Fresno | July 2026 | |
13 | Kern County Animal Control (Services) | Kern | July 2026 | |
14 | Lake County Animal Care and Control | Lake | July 2026 | |
15 | Lodi Animal Services | No data 2023 and earlier | San Joaquin | July 2026 |
16 | Madera County Animal Services | Madera | July 2026 | |
17 | Mariposa County Sheriff’s Office | No data 2024 and earlier | Mariposa | July 2026 |
18 | McFarland Animal Services | Partial data 2023/24 | Kern | July 2026 |
19 | Mono County Animal Services | No data 2024 and earlier/2025 partial | Mono | July 2026 |
20 | Napa County Animal Shelter | Napa | July 2026 | |
21 | Nevada County Animal Shelter | No data 2025 and earlier | Nevada | July 2026 |
22 | Newman Animal Services | Stanislaus | July 2026 | |
23 | Oakland Animal Services | Alameda | July 2026 | |
24 | Riverside County Department of Animal Services | Riverside | July 2026 | |
25 | San Francisco Animal Care and Control | San Francisco | July 2026 | |
26 | San Jose Animal Care and Services | No data 2025 and earlier | Santa Clara | July 2026 |
27 | Selma Animal Services | No data 2023 and earlier | Fresno | July 2026 |
28 | Stanislaus Animal Services Agency | Stanislaus | July 2026 | |
29 | Stockton Animal Shelter | San Joaquin | July 2026 | |
30 | Sutter Animal Services Authority (SASA) | Sutter | July 2026 | |
31 | Tehama County Animal Services | Tehama | July 2026 | |
32 | Tulare County Animal Services | Tulare | July 2026 | |
33 | Visalia Animal Services | Tulare | July 2026 | |
34 | Animal Resource Center of the Inland Empire | No data 2024 and earlier | San Bernardino | June 2026 |
35 | Chula Vista Animal Care Facility | San Diego | June 2026 | |
36 | Los Angeles County Animal Care and Control | Los Angeles | June 2026 | |
37 | San Bernardino City Animal Services | San Bernardino | June 2026 | |
38 | Santa Barbara County Animal Services | Santa Barbara | June 2026 | |
39 | Santa Cruz County Animal Shelter | No data 2025 and earlier | Santa Cruz | June 2026 |
40 | Sonoma County Animal Services | Sonoma | June 2026 | |
41 | Yolo County Animal Services | Yolo | June 2026 | |
42 | City of Tracy Animal Services | San Joaquin | May 2026 | |
43 | Irvine Animal Care Center | Orange | May 2026 | |
44 | County of San Diego Department of Animal Services | San Diego | April 2026 | |
45 | Hayward Animal Services Bureau | No data 2024 and earlier | Alameda | April 2026 |
46 | Humboldt County Animal Shelter | No data 2024 and earlier | Humboldt | April 2026 |
47 | City of Fowler | No data 2025 and earlier | Fresno | March 2026 |
48 | Manteca Animal Services | San Joaquin | February 2026 | |
49 | Placer County Animal Services | Placer | January 2026 | |
50 | Siskiyou County Animal Control | Siskiyou | January 2026 | |
51 | City of Burbank Animal Shelter | Los Angeles | December 2025 | |
52 | Rohnert Park Animal Services | Sonoma | December 2025 | |
53 | Monterey County Animal Services | Monterey | October 2025 | |
54 | Southeast Area Animal Control Authority (SEAACA) | Los Angeles | September 2025 | |
55 | Trinity County Animal Shelter | No data 2023 and earlier | Trinity | September 2025 |
56 | Sacramento County, Bradshaw Animal Shelter | Sacramento | June 2025 | |
57 | Del Norte County Animal Control | No data 2025 and earlier | Del Norte | March 2025 |
58 | Antioch Animal Services | Contra Costa | February 2025 | |
59 | Paradise Animal Control and Shelter | Butte | February 2025 | |
60 | Redlands Animal Control | No data 2023 and earlier | San Bernardino | December 2024 |
61 | Contra Costa County Animal Services | No data from 2023 onward | Contra Costa | July 2023 |
62 | Kings County Animal Services | No data from 2023 onward | Kings | July 2023 |
63 | Coastal Animal Services Authority | No data from 2023 onward | Orange | June 2023 |
64 | Long Beach Animal Care Services | No data from 2023 onward | Los Angeles | January 2023 |
65 | Solano County Sheriff’s Office Animal Care Division | No data from 2023 onward | Solano | January 2023 |
66 | Tri-City Animal Shelter | No data from 2023 onward | Alameda | January 2023 |
67 | Amador County Animal Control and Adoption Center | No Active Data Submission | Amador | March 2022 |
68 | East County Animal Shelter | No Active Data Submission | Alameda | September 2021 |
69 | Merced County Animal Services | No Active Data Submission | Merced | February 2021 |
70 | OC Animal Care | No Active Data Submission | Orange | December 2020 |
71 | Tulare Animal Services | No Active Data Submission | Tulare | October 2020 |
72 | Palo Alto Animal Services | No Active Data Submission | Santa Clara | December 2018 |
73 | Yuba County Animal Care Services | No Active Data Submission | Yuba | August 2018 |
74 | Calaveras County Animal Services | No Active Data Submission | Calaveras | January 2018 |
75 | Garden Grove Animal Care Services | No Active Data Submission | Orange | January 2018 |
76 | Newport Beach Animal Shelter | No Active Data Submission | Orange | December 2016 |
77 | Mendocino Animal Care Services | No Active Data Submission | Mendocino | August 2016 |
Shelter Animals Count Reporting History: 32 California Animal Services with government contract
Source: Shelter Animal Count
# | Organization Name | Comments | County | Last Reported |
1 | Animal Friends of the Valleys | No data 2023 and earlier | Riverside | July 2026 |
2 | ASAP (Animal Shelter Assistance Program) | Santa Barbara | July 2026 | |
3 | Fresno Humane Animal Services | Fresno | July 2026 | |
4 | Friends of Upland Animal Shelter | San Bernardino | July 2026 | |
5 | Haven Humane Society | Shasta | July 2026 | |
6 | Humane Society of Sonoma County | Sonoma | July 2026 | |
7 | Humane Society of the North Bay | Solano | July 2026 | |
8 | Humane Society of Truckee-Tahoe and Town of Truckee Animal Services | Nevada | July 2026 | |
9 | Inland Valley Humane Society and SPCA | Los Angeles | July 2026 | |
10 | Mendocino Coast Humane Society | Mendocino | July 2026 | |
11 | Palm Springs Animal Shelter | Riverside | July 2026 | |
12 | Sacramento SPCA | Sacramento | July 2026 | |
13 | San Diego Humane Society | San Diego | July 2026 | |
14 | San Gabriel Valley Humane Society | Los Angeles | July 2026 | |
15 | Santa Paula Animal Rescue Center (SPARC) | Ventura | July 2026 | |
16 | Siskiyou Humane Society | Siskiyou | July 2026 | |
17 | SPCA for Monterey County | No data 2024 and earlier | Monterey | July 2026 |
18 | WAGS Pet Adoption | Orange | July 2026 | |
19 | Humane Society of Imperial County | No data 2023 and earlier | Imperial | June 2026 |
20 | Pasadena Humane Society & SPCA | Los Angeles | June 2026 | |
21 | Humane Society Silicon Valley | Santa Clara | May 2026 | |
22 | Placer SPCA | Placer | May 2026 | |
23 | Marin Humane Society | Marin | April 2026 | |
24 | North Bay Animal Services | Sonoma | April 2026 | |
25 | Ventura County Animal Services | Ventura | April 2026 | |
26 | East Bay SPCA | Alameda | November 2025 | |
27 | Gimme Love Animal Shelter | No data from 2023 onward | Fresno | August 2023 |
28 | VVAPL Humane Society | No data from 2023 onward | San Bernardino | June 2023 |
29 | City of Bakersfield Animal Care Center | No Active Data Submission | Kern | January 2022 |
30 | Friends of the Alameda Animal Shelter | No Active Data Submission | Alameda | August 2020 |
31 | Petaluma Animal Services Foundation | No Active Data Submission | Sonoma | May 2018 |
32 | Friends of Orange Cove Animal Shelter | No Active Data Submission | Fresno | March 2016 |
California is not presented here as an estimate of national participation. Rather, it illustrates the methodological difficulty of assessing representativeness when the underlying population is itself incompletely enumerated. We briefly reviewed Texas organizations’ participation in the same data system. The examples below illustrate similar gaps in reporting and participation.
Shelter Animals Count Organizational Participation Examples.Texas
4. Recorded Shelter Intake Does Not Necessarily Represent Companion Animal Homelessness
Managed Intake, Intake Restrictions, and Measurement Bias: California Evidence
Construct validity concerns whether a measured variable adequately represents the phenomenon it is being used to describe.
The study analyzes animals formally recorded by participating shelters. Companion animal homelessness, however, encompasses a potentially broader population.
Under contemporary shelter operating models, an animal requiring assistance may never become a recorded shelter admission. Managed intake, appointment requirements, admission restrictions, temporary intake suspensions, finder-retention programs, surrender diversion, waiting lists, direct rescue placement, and other community-based pathways can determine whether an animal enters shelter custody.
As a result, two conceptually distinct populations should be distinguished and quantified:
Recorded Shelter Population — animals that are formally admitted into the shelter system and therefore appear in shelter intake and outcome data. The current analysis focuses only on this population.
Non-Shelter / Community homeless companion animal population requiring intervention: homeless or unowned animals remaining in the community after shelter intake is denied or not provided, and requiring rescue, veterinary care, reunification, sterilization, behavioral support, foster care, or placement assistance, and not systematically recorded or reflected in official shelter intake and outcome statistics data. ( Ghost animals)
The degree of overlap between these populations is not fixed. It can vary by jurisdiction and over time according to shelter accessibility, available capacity, admission policies, rescue capacity, and community-based programs.
Consequently, a decline in recorded shelter intake does not, by itself, establish a corresponding decline in companion animal homelessness or community demand for animal welfare services.
This distinction is particularly relevant when shelter-derived data are interpreted within research addressing homelessness of dogs and cats. Shelter intake is a measurable operational variable; homelessness is a broader population construct. Establishing the relationship between the two requires additional information concerning animals that seek or require intervention but remain outside formal shelter custody.
Factor 1: Animals Presented for Shelter Admission but Not Admitted
Example — San Jose: Public-record data indicates that approximately 20% of animals presented for shelter assistance within the population examined were not admitted into shelter custody. Even within a single city, this represents a substantial population of animals whose needs and outcomes may be absent from traditional shelter intake statistics. Over time, this could represent thousands of animals remaining in the community rather than appearing in formal shelter intake and outcome data.
When shelters resort to limiting intake because demand exceeds their capacity, fewer recorded admissions are not evidence of improvement—they may be evidence of a growing crisis that is increasingly being carried by the community.
San Jose Case Study: Animals Presented to the Shelter but Remaining Outside the Reported System
A review of San Jose Animal Care Center intake logs and public-facing PetCompass records identifies a significant population of animals that are presented to or registered with the shelter but never formally enter shelter custody—and therefore are not reflected in conventional shelter intake and outcome statistics.
For the seven-month period reviewed from June 2025 through January 2026, intake logs documented 4,227 animals presented to the shelter, of which 940—approximately 22%—were not documented as accepted into custody. These entries included outcomes such as Redirect, Redirect – No Space, Redirect – Another Date, Found Report, and other categories. The records generally did not establish what ultimately happened to these animals.
Partial-month records from 2024–2025 illustrate the same pattern. For example, on April 26, 9 of 19 animals presented were not accepted, while on April 25, April 18, and April 4, six animals on each reviewed day were not accepted into custody.
The review also examined found dogs and cats that remained with their finders rather than entering the shelter. Some were published through PetCompass, with finder contact information provided so owners or potential adopters could contact the finder directly. Sample snapshots identified 29 dogs on July 2, 2026; 24 dogs and 36 cats on July 21; and 17 dogs and 33 cats on August 6 listed as remaining with finders.
These listings generally disappear from public display after approximately 30 days. The report found that, unless an animal subsequently entered the shelter and received a documented outcome, its location, welfare, and final disposition could not be established through PetCompass or the publicly accessible shelter intake/outcome dataset. A follow-up of the July 2 cohort illustrates this problem: some animals could be connected to later shelter outcomes, while numerous others were simply no longer displayed when checked on July 21.
The broader data concern is significant: declining shelter intake numbers do not necessarily represent the full volume of animals for which the public seeks animal-control assistance. Animals redirected, registered as found but left with residents, or otherwise kept outside formal custody can disappear from traditional shelter statistics even though the community is still dealing with those animals and assuming responsibility for their care and placement.
Data examined: Data Extracted From SJACC Intake Logs, SJACC Intake Logs.
SJACC, June 2025 - January 2026 | ## of Animals | Notes |
Interactions logged | 4715 | |
All Animals represented | 6316 | TNR, Surrender, Found, Euthanasia, Stray, Transfer, Tails & Trails program, Wildlife, Disposal, etc. |
Accepted animals | 33287 | |
Animals not explicitly accepted | 940* | |
Animals with an “Other” outcome | 2089 | Other Jurisdiction, Euthanised, Other Shelter, Wildlife Center, TNR |
*
We reviewed individual shelter records and separated them based on why the animal was brought to the shelter and what ultimately happened when assistance was requested.
Excluded: Records where the reason for bringing the animal to the shelter was euthanasia, TNR, wildlife, disposal, Tails & Trails program, transfer, information request only, spay/neuter, or foster surgery.
Included: Records where the “Result” field showed that the animal was not accepted into shelter care and was instead redirected or provided another option. These results included: Redirect – Private Medical, Found Report, RTF (person directed to release the animal), Redirect – Another Date, Redirect, Provide Rescue Resources (rescue list), Other Shelter.
This allowed us to focus specifically on records involving animals presented for assistance but redirected away from shelter intake, rather than unrelated services or programs.
Out of 940 not explicitly accepted animals:
54 animals had a blank “Result” field, leaving the outcome unknown.
59 animals had the Result listed as “Connect Finder/Owner.” Of these, 38 had a blank Notes field, leaving the final outcome unknown.
The examined dataset does not include Animal IDs (A#). As a result, further reconciliation with the publicly accessible Animal Shelter Intake and Outcomes dataset is not possible.
Other forms of animal reporting, such as phone calls or online submissions, were not considered in this analysis. Because multiple residents reported on social media that, after contacting the shelter by phone, they were directed not to bring the found animal to the shelter or submit an online found-animal report while housing the animal, the actual number of animals denied intake may be substantially higher than reflected in the analyzed records.
Read full Report: Found/Finder animals Not accepted in San Jose ACC
Factor 2: Substantial Declines in Recorded Intake Across Major Shelter Systems
A second factor is the substantial reduction in recorded shelter intake across major California shelter systems over time. Our review of three large shelter systems found pronounced declines in the number of animals formally entering shelter custody, including systems where annual intake fell by tens of thousands of animals compared with earlier years.
These reductions are particularly important when considered alongside changes in intake practices—including managed or appointment-based intake, diversion, finder-foster programs, and other practices that can defer or prevent animals from entering shelter custody.
The historical intake data presented below demonstrate the scale of the change across the three shelter systems examined. When considered together with Factor 1, these trends raise an important question: to what extent does declining recorded intake represent a true reduction in community need, and to what extent does it reflect animals remaining outside the formal shelter system?
Substantial contractions across multiple California shelter systems, including Los Angeles County Animal Care & Control, San Jose Animal Care & Services, and SEAACA.
Exhibit 1: Los Angeles Intake and Outcome Historical Data.
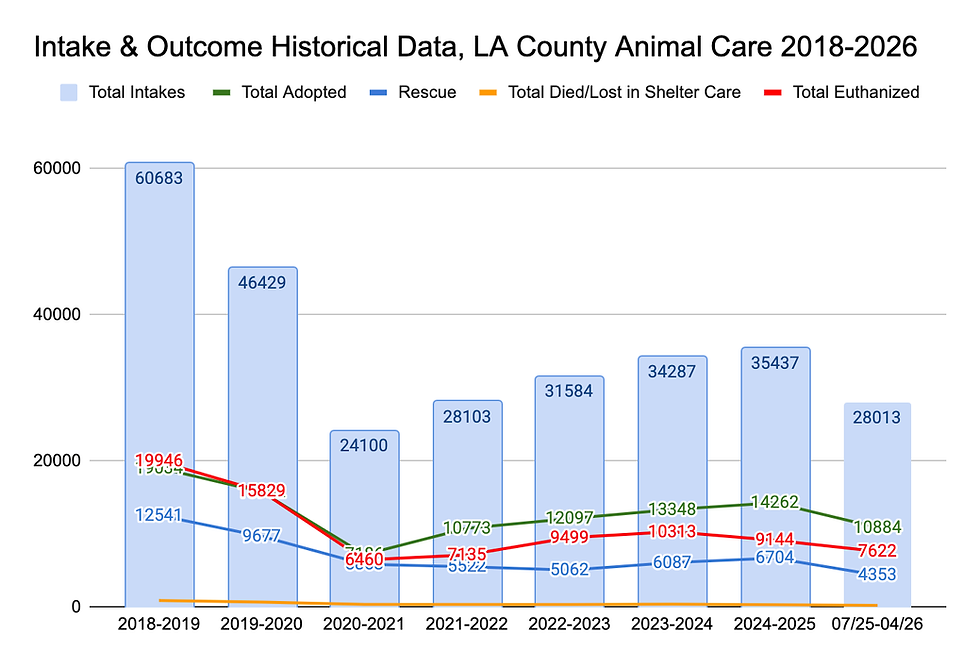
Performance Summary, LA County Animal Care
Trends: | % | FY 2018-19 | FY 2024-25 |
Animal Intakes Reduction: 2018 - 2025 | -41.60% | 60683 | 35437 |
Transfer to Rescues Reduction 2018 - 2025 | -46.54% | 12541 | 6704 |
Adoption | –35% | 19034 | 14262 |
Non Alive Growth from FY 21/22 - FY 23/24From 7488 to 10707 Animals | +4.39% | ||
Non Alive Growth from FY 24/25 - FY 25/26 (Partial)From 9462 to 7848 Animals | +2.62% |
Exhibit 2: San Jose Intake and Outcome Historical Data.
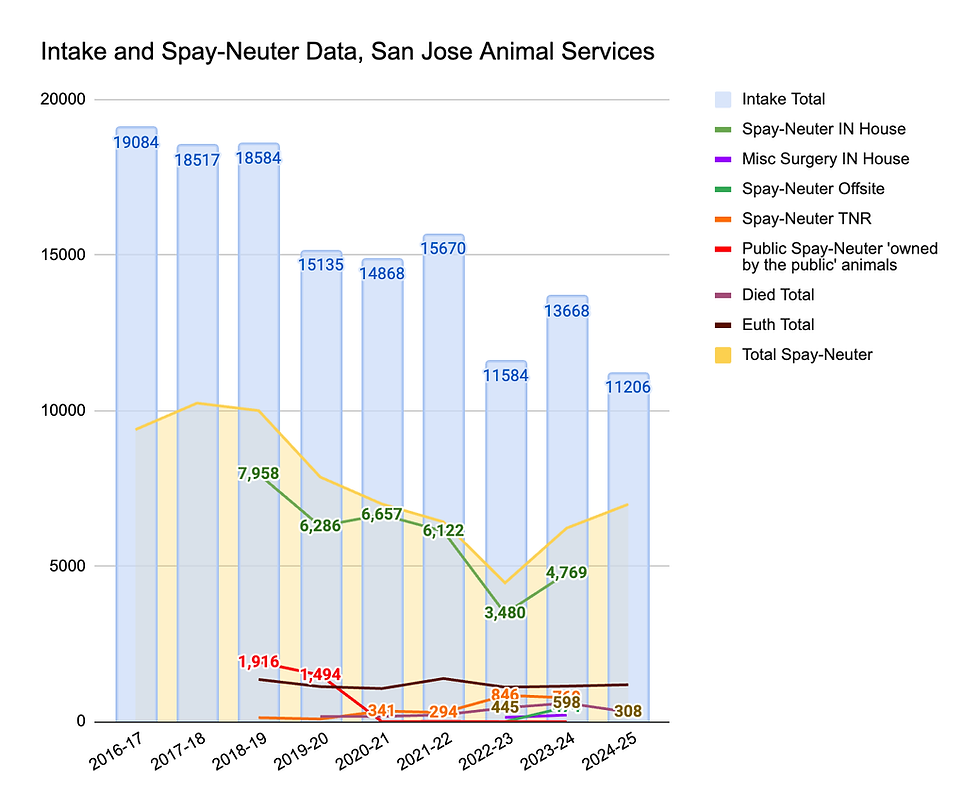
Trends: | % | 2018-19 | 2024-25 |
Animal Intakes Reduction: 2018 - 2025 | - 40% | 18,584 | 11,206 |
Transfer to Rescues Reduction 2018 - 2025 | - 69.4% | 4630 | 1415 |
Adoption | +6.8 | 4348 | 4644 |
Non Alive Growth from FY2018/19 - FY2024/25 From 1357 to 1531 Animals | +6.36% | 1357 | 1531 |
Exhibit 3: SEAACA Intake and Outcome Historical Data.
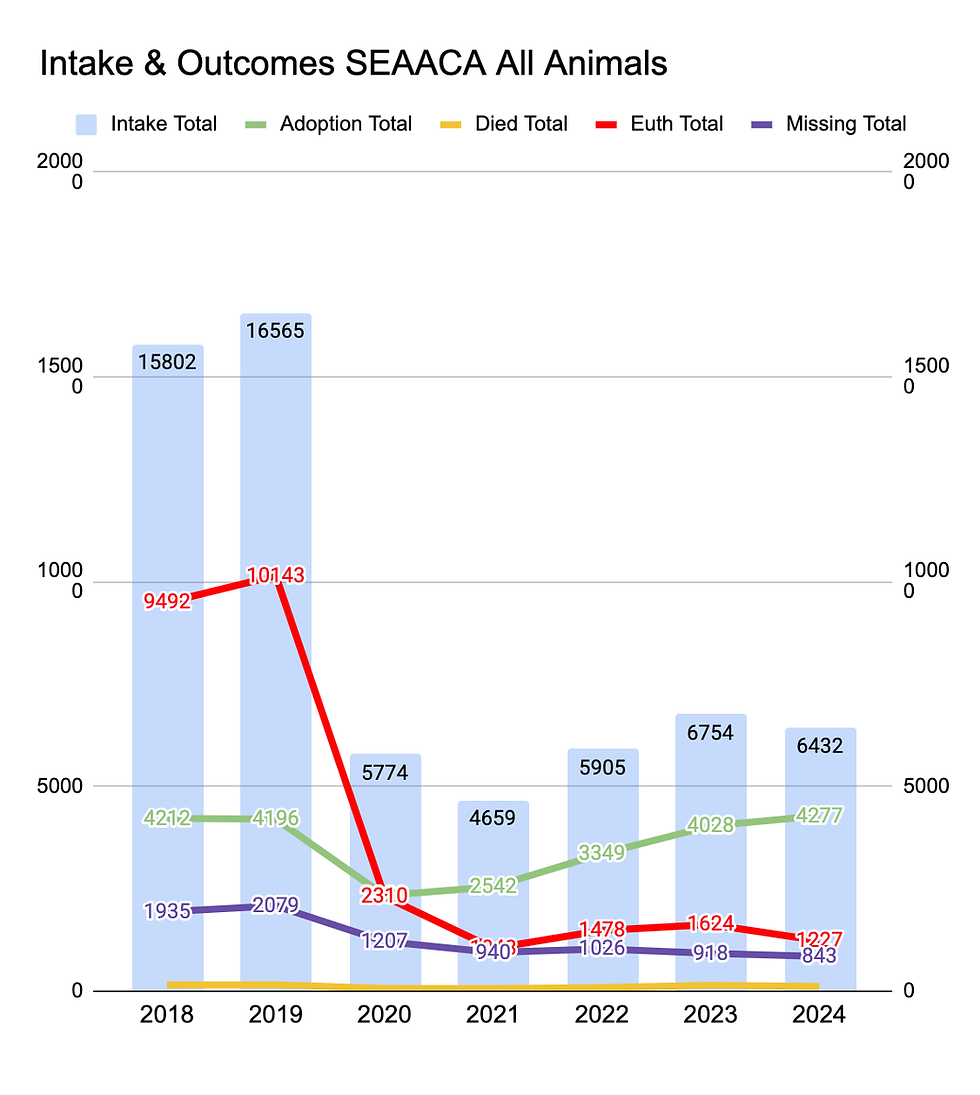
Trends: | % | 2018 | 2024 |
Animal Intakes Reduction: 2018 - 2024 | -59.30% | 15802 | 6432 |
Adoption | +1.5 | 4212 | 4277 |
Transfer to Rescues 2018 - 2024 | Unknown | Unknown | Unknown |
Non Alive Outcome for CY2018 - CY2024 From 9492 to 1227 Animals | -87% | 9492 | 1227 |
Exhibit 4: Frozen, deferred Intakes Examples: San Jose Animal Services, Stanislaus Animal Services
5. Ability of the Analytical Dataset to Distinguish Among Competing Mechanisms
Interpretation of statistical associations depends upon whether the analytical dataset contains variables capable of distinguishing among plausible explanations for observed relationships.
A conclusion that shelter crowding resolves primarily through increased adoptions rather than reduced intake requires consideration of factors determining recorded intake itself. If admission policies materially affect which animals enter shelter custody, recorded intake cannot be assumed to represent community demand independently of those policies.
The analytical dataset does not report variables describing several operational practices capable of affecting recorded intake, including:
managed-intake systems;
appointment-based admissions;
temporary admission suspensions or intake freezes;
declined owner surrenders;
waiting lists;
surrender-diversion programs;
finder-retention policies;
direct rescue intervention before shelter admission; and
other policies determining whether an animal enters formal shelter custody.
Recorded intake may therefore change through several mechanisms: changes in underlying community animal populations, changes in shelter accessibility, changes in operational capacity, diversion to nonprofit organizations, retention by finders or owners, delayed admissions, or combinations of these factors.
Because these mechanisms are not individually represented within the analytical dataset, their relative contribution cannot be directly evaluated through the reported intake, census, and outcome variables alone.
The resulting analysis can describe relationships among recorded admissions, census, and recorded outcomes. It cannot independently establish what proportion of observed change is attributable to unmeasured admission restrictions or other pathways operating before an animal enters the dataset.
This distinction is particularly relevant to statements that crowding resolves primarily through increased adoptions rather than reductions in intake. Such interpretation requires either measurement of the competing intake mechanisms or an explicit assumption that changes in shelter-access policies are not materially affecting recorded intake.
Future analyses could address this limitation by incorporating standardized measures of shelter accessibility, managed-intake status, declined admissions, diversion activity, waiting-list duration, finder-retention programs, and rescue-system participation.
6. Omitted Operational Variables and the Interpretation of Recorded Shelter Intake
Recorded shelter intake is not solely a function of the number of animals requiring assistance within a community. It is also a function of the policies and operational capacity that determine whether those animals are admitted into shelter custody. This distinction is important when recorded intake is used as an explanatory variable in analyses of shelter census and outcomes.
Conceptually, the observed relationship can be represented as:
Community demand for animal welfare intervention
↓
Shelter accessibility and admission policies
↓
Recorded shelter intake
↓
Shelter census and recorded outcomes
The intermediate stage—shelter accessibility—is therefore potentially important. Managed-intake policies, appointment requirements, waiting lists, temporary or prolonged intake restrictions, diversion programs, finder-retention policies, and the availability of nonprofit rescue alternatives can all influence whether an animal requiring assistance becomes a recorded shelter admission.
If these variables are not measured, changes in recorded intake cannot necessarily be attributed solely to changes in the underlying population of animals requiring shelter services.
For example, two jurisdictions experiencing comparable community demand could report substantially different intake levels if one maintains broadly accessible admission while another restricts admissions, requires appointments, redirects finders, or relies extensively on nonprofit organizations to absorb animals outside municipal custody. Similarly, the same jurisdiction could report declining intake over time following a change in admission policy even if underlying community demand remained stable or increased.
This distinction is particularly important when interpreting relationships among intake, census, and outcomes. If shelter-access policies influence the number and composition of animals entering the analytical dataset, they may also indirectly influence subsequent census, adoption, transfer, euthanasia, and length-of-stay measures.
Thus, an observed relationship between recorded intake and subsequent shelter census does not independently establish why intake changed.
Several competing mechanisms remain possible:
actual changes in the number of animals requiring assistance;
changes in shelter admission capacity;
implementation or expansion of managed intake;
appointment-based or delayed surrender;
temporary or prolonged intake restrictions;
diversion of animals before formal admission;
finder retention;
direct placement with nonprofit rescue organizations; and
changes in the capacity of the surrounding rescue and foster network.
These mechanisms are not necessarily mutually exclusive and may operate simultaneously.
This creates a potential confounding problem when recorded shelter intake is interpreted as a direct proxy for community-level animal need. Shelter admission policy can affect the measured exposure—recorded intake—while also influencing the population subsequently observed within the shelter.
Accordingly, analyses based exclusively on recorded shelter admissions cannot independently distinguish a reduction in community demand from a reduction in access to shelter admission unless shelter-access variables are also measured.
This limitation is directly relevant to interpretations concerning the mechanisms through which shelter census increases subsequently resolve. If the analytical dataset contains intake, census, adoption, transfer, and euthanasia outcomes but does not contain measures of admission restrictions, declined intake, waiting lists, finder retention, or diversion, the relative contribution of these unobserved mechanisms cannot be directly estimated from the reported variables.
The appropriate inference is therefore narrower: the analysis can identify relationships among recorded intake, recorded census, and recorded outcomes within participating organizations. Determining whether those relationships reflect changes in the broader companion animal population, shelter-access policies, community diversion, or combinations of these factors requires additional data.
Future analyses could substantially strengthen causal interpretation by incorporating standardized measures of shelter accessibility, including admission policy, appointment requirements, periods of restricted or suspended intake, number of admission requests, number of declined or deferred admissions, waiting-list volume and duration, finder-retention activity, diversion activity, and direct rescue placement.
Such variables would permit researchers to distinguish changes occurring before shelter admission from changes occurring after animals enter shelter custody.
This distinction is fundamental because the analytical boundary of a shelter dataset begins at admission, whereas the population process producing that admission begins in the community.
7. Historical Data Retention and Reproducibility
Study Period: 2022–2024 — Period of Severe COVID and Post-COVID Shelter Intake Restrictions
The study, “Shelter Dog Census Changes Track Intakes but Resolve Slowly via Outcomes and Especially Adoptions,” is an observational, retrospective analysis using monthly dog statistics from the Shelter Animals Count database for U.S. government-related (GRO) and non-governmental (NGO) sheltering organizations during 2022–2024. Importantly, this study period overlaps with a period in which many shelter systems were still operating under, or emerging from, significant COVID-era and post-COVID intake restrictions, managed-intake practices, and reduced admissions. This context is important when interpreting recorded intake as a measure of the broader population of dogs requiring shelter or community assistance.
Longitudinal interpretation depends upon stable historical datasets and sufficient temporal coverage to distinguish short-term fluctuations from structural changes.
Our review of California municipal shelter reporting identified cases in which publicly accessible historical information is limited to relatively short periods, earlier annual reports are no longer readily available, static reports have been replaced by dynamic dashboards, or reporting categories have changed over time.
Short Historical Data Windows Can Obscure Major Changes in Shelter Operations
A 4-year analytical or publicly accessible window can be particularly consequential where major operational changes occurred immediately before or during that period. Changes associated with the COVID-19 pandemic, managed-intake adoption, altered surrender policies, reduced public access to shelters, deteriorated spay/neuter capacity, and new diversion practices may substantially affect the baseline against which later trends are evaluated.
Short historical windows therefore create a risk of interpreting a changed operating environment as the historical norm.
This differs from the data infrastructure commonly available in major public-sector domains such as education, public health, crime, transportation, and environmental monitoring, where substantially longer historical series are frequently maintained for longitudinal analysis and public accountability. The relevant methodological principle is not that every public dataset must retain identical periods, but that conclusions regarding trends depend upon an adequate and reproducible historical baseline.
Historical accessibility is also necessary for independent replication. If source data are removed, dynamically revised, or available only for limited periods, outside researchers may be unable to reconstruct prior analyses or determine whether apparent longitudinal changes resulted from changes in the underlying population, operational policies, definitions, or reporting methodology.
National shelter research would therefore benefit from permanent archival datasets, documented methodological changes, versioned historical records, and retention periods sufficient to evaluate structural changes over time.
8. Methodological Heterogeneity of Life Release Rate
Reliable comparative research requires participating organizations to measure equivalent variables using consistent definitions and methodologies. When a common performance indicator is calculated differently across jurisdictions, variation in reported values may reflect differences in mathematical construction rather than differences in operational performance.
Review of California municipal shelter reporting identified substantial heterogeneity in the calculation of Life Release Rate (LRR). Although organizations use the same metric name, underlying formulas vary in denominator selection, exclusion criteria, and treatment of euthanasia and other outcomes.
For example, the reviewed materials show Kern County using an intake-based calculation, San Jose using an outcome-based calculation, and SEAACA reporting two LRR calculations using different methodologies. These formulas therefore do not necessarily measure identical quantities.
Kern County Life Release Rate (LRR) is calculated using intake-based data, where outcomes are measured against total animals entering the shelter system:

Under this approach, owner-requested euthanasia of unhealthy and untreatable animals is excluded from euthanasia totals, which directly affects the reported Life Release Rate.SEAACA provides 2 different LRR numbers: for adoptable animals and for all animals.
The formula for determining adoptable animals is similar to San Jose ACC’s, with one key difference: San Jose ACC excludes owner-requested euthanasia of unhealthy and untreatable animals, while SEAACA excludes euthanasia of all unhealthy and untreatable animals.

Both formulas provided by SEAACA are not directly comparable, which raises questions about the consistency and reliability of the methodology used to calculate LRR. The two approaches rely on fundamentally different inputs and structures, making it difficult to interpret results or draw meaningful comparisons. This level of variation is unexpected for a single metric and warrants clarification on which method is considered authoritative and why different formulas are being applied.
This variation has direct implications for comparative analysis. Two organizations reporting the same numerical LRR may have reached that value through different denominators and exclusions, while identical operational outcomes could produce different LRR values under different formulas.
LRR should therefore be treated as a potentially heterogeneous family of related operational measures unless the underlying formula is standardized or explicitly harmonized before comparison.
Where local shelter data are aggregated for statewide or national analysis, standardized definitions, denominator rules, exclusions, and outcome classifications are necessary to determine whether participating organizations are measuring comparable constructs.
9. Evolution of Shelter Performance Metrics and Longitudinal Interpretation
Changing Performance Metrics and Loss of Longitudinal Comparability
The metrics used to characterize shelter performance have changed substantially over time. Methodological change is not inherently problematic; derived and composite performance measures are routinely used in other data-intensive public sectors. The methodological concern arises when definitions, denominators, exclusions, classifications, or calculation methods differ across reporting entities or change over time without sufficient preservation of the underlying data needed to reconstruct and compare historical trends.
Historically, municipal shelter reporting relied heavily on direct operational counts, including total intake, adoptions, return-to-owner, transfers, euthanasia, and euthanasia relative to intake. These measures documented the volume and disposition of animals moving through shelter systems and preserved underlying counts from which changes in shelter activity could be evaluated over time.
More recently, Live Release Rate (LRR), live-outcome measures, and other composite performance indicators have become increasingly prominent. The adoption of such measures is not itself a methodological weakness. However, our review of California shelter reporting demonstrates that LRR is not calculated uniformly across jurisdictions. Different shelters use different denominators, exclusions, and outcome classifications, meaning that values presented under the same metric name may represent mathematically different measures.
This heterogeneity creates an important limitation for both cross-jurisdictional and longitudinal analysis. A historical series cannot be assumed to remain methodologically comparable when the populations included, outcome classifications, exclusion criteria, denominators, or calculation methods change over time.
Consequently, an apparent improvement in a contemporary performance indicator may reflect several different phenomena: an actual improvement in animal outcomes; a change in the number or composition of animals admitted; a change in admission practices; a change in outcome classification; a change in denominator or exclusion criteria; or a change in the performance metric itself. Without the underlying historical counts and explicit documentation of methodological changes, these explanations may be difficult—or impossible—to distinguish.
This becomes particularly consequential when contemporary performance measures are used to characterize the historical trajectory of an entire shelter system.
A newly adopted metric cannot retrospectively create a methodologically continuous historical series when the underlying definitions, denominators, classifications, or populations being measured have changed.
The problem is further compounded when older operational datasets are removed from public access, replaced by dynamic dashboards, or retained for only limited periods. Under these circumstances, independent researchers may be unable to reconstruct historical performance using a consistent methodology, reproduce earlier analyses, or determine whether an observed trend represents a change in animal welfare conditions or a change in measurement.
Derived and composite measures are routinely used in education, health care, public health, criminal justice, transportation, environmental monitoring, and other public-sector systems. Their use does not inherently compromise longitudinal analysis. Rather, meaningful comparison depends upon transparent definitions, consistent calculation methods, preservation of underlying data, and documentation of methodological changes. Where methodologies change materially, historical comparisons require qualification, recalculation, or methodological reconciliation before the resulting measures can reasonably be treated as directly comparable.
The same principle should apply to animal shelter research. Composite performance metrics should supplement, rather than replace or obscure, the underlying operational counts from which they are derived. Original intake and outcome data should remain accessible; changes in definitions, exclusions, denominators, and calculations should be documented; and researchers should establish whether pre-change and post-change measures are methodologically comparable before treating them as a continuous historical series.
The methodological concern is therefore not the existence or use of LRR itself, but the lack of uniformity in its calculation and the potential loss of longitudinal comparability when changing performance measures are combined with limited access to the underlying historical data.
Without these safeguards, conclusions about improvement or deterioration risk conflating changes in the condition of the animal welfare system with changes in how that system is measured.
10. Operational Metrics and Population Indicators Measure Different Constructs
Shelter performance measures and companion animal population measures serve different analytical purposes.
Operational indicators such as LRR, length of stay, shelter census, adoption rate, and transfer rate primarily characterize processes occurring within or through shelter systems. They can provide useful information concerning organizational operations.
Companion animal homelessness is a broader population-level phenomenon.
A shelter can reduce census through adoption, transfer, foster placement, reduced admission, finder retention, diversion, or other mechanisms. Several of these pathways reduce the number of animals physically housed within a shelter without necessarily reducing the number of animals requiring assistance in the surrounding community.
Accordingly, improvement in an operational shelter metric should not automatically be interpreted as evidence of proportional improvement in community-level companion animal homelessness.
The distinction becomes especially important when shelter accessibility itself changes. If fewer animals are admitted, subsequent shelter census and outcome measures describe a more selectively admitted population. Interpretation of those measures therefore requires information concerning the animals remaining outside the formal shelter system.
11. Standardization as a Prerequisite for National Benchmarking
National benchmarking requires more than aggregation of large numbers of observations. It requires evidence that participating organizations are measuring sufficiently comparable variables and that the analytical population is adequately characterized.
The California examples reviewed here demonstrate variation in organizational participation, operational definitions, LRR formulas, denominator selection, exclusion criteria, historical data availability, and reporting structures. These sources of heterogeneity introduce uncertainty when local data are aggregated into broader reference values.
Future national reporting and research would be strengthened by standardized definitions for:
intake and admission;
declined or deferred intake;
euthanasia categories;
transfers;
return-to-field and related programs;
managed intake;
finder retention;
diversion;
LRR and other summary performance measures;
denominator and exclusion rules; and
methodological changes occurring over time.
Standardization should be accompanied by transparent metadata describing which organizations use each methodology and when methodological changes occurred.
Without this information, aggregation may increase numerical sample size without necessarily increasing measurement comparability.
Full version:


Comments